Dashboard overview
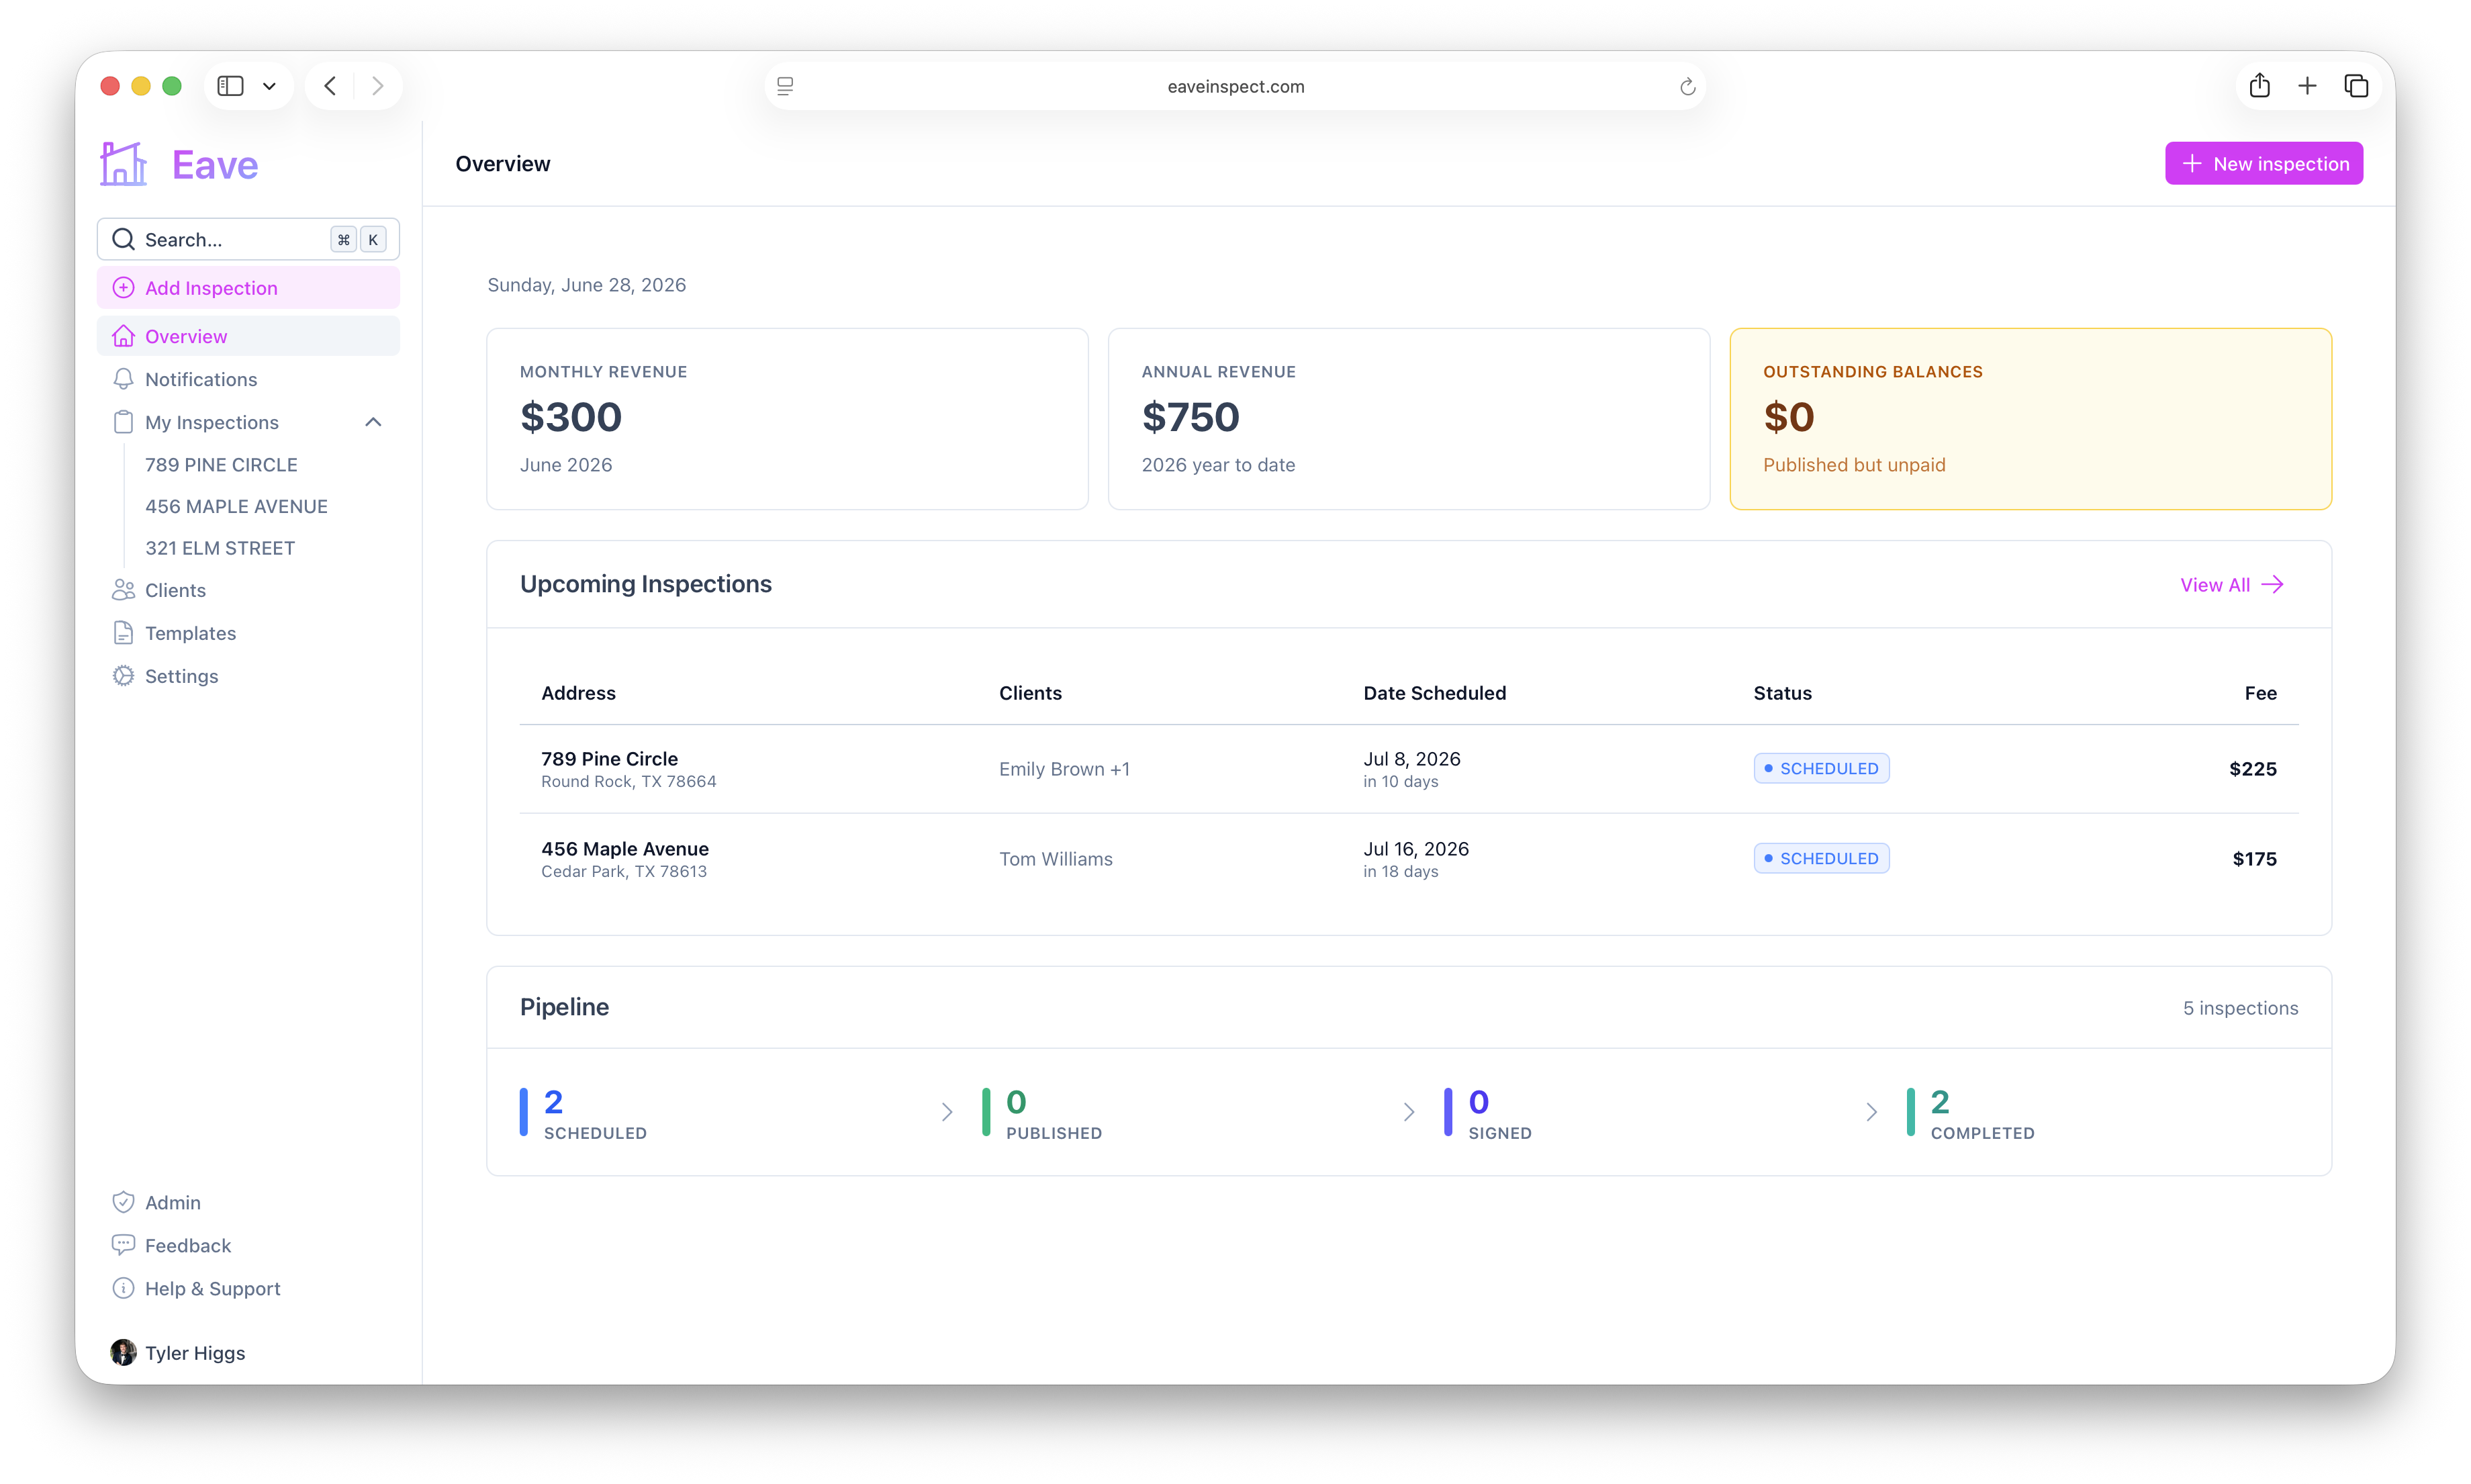
The dashboard is your home base. The left sidebar gives you access to everything — inspections, clients, templates, and settings — and stays with you as you work.
The sidebar
- Overview — your dashboard landing page.
- Notifications — organization invitations and report-signing activity.
- My Inspections — your in-progress (draft) inspections, with quick links to the most recent ones.
- Clients — people you've added across inspections.
- Templates — the sample library and your custom templates.
- Settings — your account, organization, notifications, and billing.
At the bottom you'll also find Feedback and Help & Support, plus your organization and profile buttons.
Adding an inspection
Use the Add Inspection button near the top of the sidebar to start a new inspection. Full walkthrough: Add an inspection.
Search (command palette)
Click the search button in the sidebar (or press K) to open the command palette. You can jump to any page, open a specific inspection, or search this Help Center — help articles appear in their own Help & Docs group at the bottom of the results.
Notifications
The Notifications bell shows organization invitations (which you can accept or decline) and alerts when a client signs a report. See Inviting members.
Settings & account
Your profile and organization buttons live at the bottom of the sidebar. A small pulsing dot on your profile means some required profile fields are still incomplete — click through to finish them. See Business profile & licensing.